What kind of data does your company have?
Knowing what kind of data your business has can help you understand how you can use it.

So your business has some data and you’re wondering what can be learned from it. Is it numerical or categorical? Does it have high dimensionality or cardinality?
Dimension-what-ity?
It’s no secret that data is everywhere. But it’s important to recognise not all data is the same. You might have heard the term data cleaning before. And if you haven’t, it’s not too different to regular cleaning.
When you decide it’s time to tidy your house, you put the clothes on the floor away, and move the stuff from the table back to where it should go. You’re bringing order back to a chaotic environment.
The same thing happens with data. When a machine learning engineer starts looking at a dataset, they ask themselves, ‘where should this go?’, ‘what was this supposed to be?’ Just like putting clothes back in the closet, they start moving things around, changing the values of one column and normalising the values of another.
But wait. How do you know what to do to each piece of data?
Back to the house cleaning analogy. If you have a messy kitchen table, how do you know where each of the items goes?
The spices go in the pantry because they need to stay dry. The milk goes back in the fridge because it has to stay cold. And the pile of envelopes you haven’t opened yet can probably go into the study.
Now say you have a messy table of data. One column has numbers in it, the other column has words in it. What could you with each of these?
A convenient way to break this down is into numerical and categorical data.
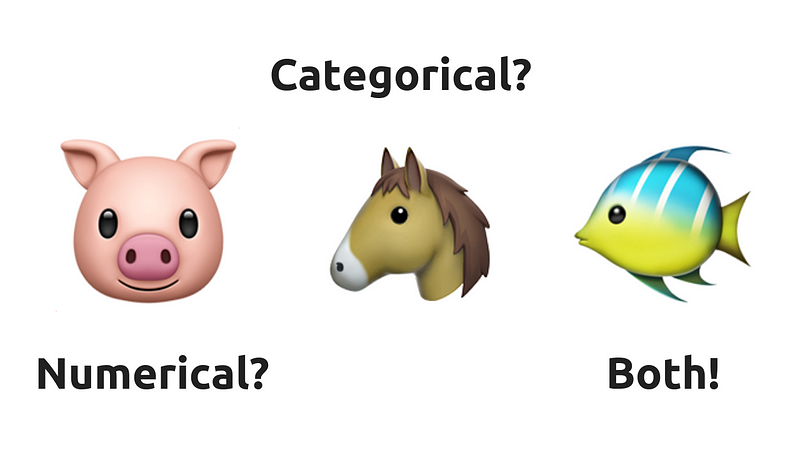
Before we go further, let’s meet some friends to help unpack these two types of values.
Harold the pig loves numbers. He counts his grains of food every day.
Klipklop the horse watches all the cars go past the field and knows every type there is.
And Sandy the fish loves both. She knows there’s safety in numbers and loves all the different types of marine life under the sea.
Numerical data
Like Harold, computers love numbers.
With any dataset, the goal is often to transform it in a way so all the values are in some kind of numerical state. This way, computers can work out patterns in the numbers by performing large-scale calculations.
In Harold’s case, his data is already in a numerical state. He remembers how many grains of food he’s had every day for the past three years.
He knows on Saturdays he gets a little extra. So he saves some for Mondays when the supply is less.
You don’t necessarily need a computer to figure out this kind of pattern. But what if you were dealing with something more complex?
Like predicting what Company X’s stock price would be tomorrow, based on the value of other similar companies and recent news headlines about Company X?
Ok — so you know the stock prices of Company X and four other similar companies. These values are all numbers. Now you can use a computer to model these pretty easily.
But what if you wanted to incorporate the headline ‘Company X breaks new records, an all-time high!’ into the mix?
Harold is great at counting. But he doesn’t know anything about the different types of grains he has been eating. What if the type of grain influenced how many pieces of grain he received? Just like how a news headline may influence the price of a stock.
The kind of data that doesn’t come in a straightforward numerical form is called categorical data.
Categorical data
Categorical data is any kind of data which isn’t immediately available in numerical form. And it’s typically where you will hear the terms dimensionality and cardinality thrown around.
This is where Klipklop the horse comes in. He watches the cars go past every day and knows the make and model of each one.
But say you wanted to use this information to predict the price of a car.
You know the make and model contribute something to the value. But what exactly?
How do you get a computer to understand that a BMW is different from a Toyota?
With numbers.
This is where the concept of feature encoding comes in. Or in other words, turning a category into a number so that a computer learns how each of the numbers relates.
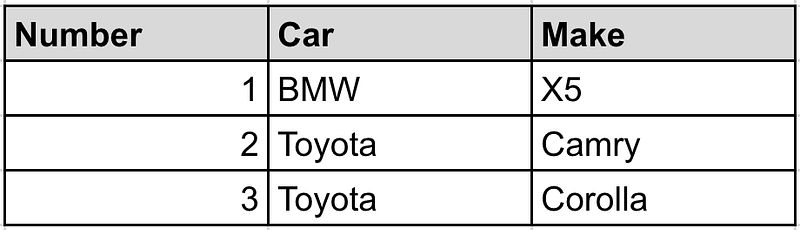
Let’s say it’s been a quiet day and Klipklop has only seen 3 cars.
A BMW X5, a Toyota Camry and a Toyota Corolla. How could you turn these cars into numbers a machine could understand whilst still keep their inherent differences?
There are many techniques, but we’ll look at two of the most popular — one-hot-encoding and ordinal encoding.
Ordinal Encoding
This is where the car and its make are assigned a number in the order they appeared.
Say the BMW went by first, followed by the Camry, then the Corolla.
But does this make sense?
By this logic, a BMW + Toyota should equal a Toyota (1 + 2 = 3). Not really.
Ordinal encodings can be used for some situations like time intervals but it’s probably not the best choice for this case.
One-hot-encoding
One-hot encoding assigns a 1 to every value that applies to each individual car, and 0 to every value that does not apply.
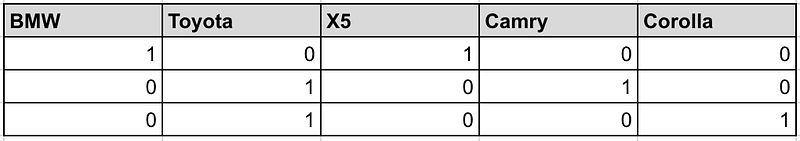
Now our two Toyotas are similar to each other because they both have 1’s for Toyota but differ on their make.
One-hot-encoding works well to encode category values into numbers but has a downfall. Notice how the number of values used to describe a car increased from 2 to 5.
This is where the term high dimensionality gets used. There are now more parameters describing what each car is than there is the number of cars.
For a computer to learn meaningful results, you want the ratio to be high in the opposite way.
In other words, you’d prefer to have 6,000 examples of cars and only 6 ways of describing them rather than the other way round.
But of course, it doesn’t always work out this way. You may end up with 6,000 cars and 1,000 different ways of describing them because Klipklop has seen 500 different types of makes and models.
This is the issue of high cardinality — when you have many different ways of describing something but not many examples of each.
For an ideal price prediction system, you’d want something like 1,000 Toyota Corollas, 1,000 BMW X5s and 1,000 Toyota Camrys.
Ok, enough about cars.
What about our stock price problem? How could you incorporate a news headline into a model?
Again, you could do this a number of ways. But we’ll start with a binary representation.
Binary Encoding
You were born before the year 2000, true or false?
Let’s say you answered true. You get a 1. Everyone born after the year 2000 gets a 0. This is binary encoding in a nutshell.
For our stock price prediction, let’s break our news headlines into two categories — good and bad. Good headlines get a 1 and bad headlines get a 0.
With this information, we could scan the web, collecting headlines as they come in and feeding these into our model. Eventually, with enough examples, it would start to get a feel of the stock price changes based on the value it received for the headline.
And with the model, you start to notice a trend — every time a bad headline comes out, the stock price goes down. No surprises.
We’ve used a simple example here and binary encodings don’t exactly capture the intensity of a good or bad headline. What about neutral, very good or very bad? This is where our the previously discussed ordinal encoding could come in.
-2 for very bad headlines, -1 for bad, 0 for neutral, 1 for good and 2 for very good. Now it makes sense that very bad + very good = neutral.
There are more complex ways to bring words into a machine learning model but we’ll leave those for a future article.
The important thing to note is that there are many different ways seemingly non-numerical information can be converted into something a computer can understand.
What can you do?
Machine learning engineers and data scientists spend much of their time trying to think like Sandy the fish.
Sandy knows she’ll be safe staying with the other school of fish but she also knows there’s plenty to learn from exploring the unknown.
It’s easy to lean on only numerical information to draw insights from. But there’s so much more information hidden in diverse ways.
By using a combination of numerical and categorical information, more realistic and helpful models of the world can be built.
It’s one thing to model the stock market using price information, but it’s a whole other game when you add news headlines to the mix.
If you’re looking to start harnessing the power of your data with techniques like machine learning and data science, there are a few things you can to get the most of it.
Normalising your data
If you’re collecting data, what format is it stored in?
The format itself isn’t necessarily as important as the uniformity. Collect it but make sure it’s all stored in the same way.
This applies for numerical and categorical data, but especially for categorical data.
More is better
The ideal dataset has a good balance between cardinality and dimensionality.
In other words, plenty of examples of each particular sample.
Machines aren’t quite as good as humans when it comes to learning (yet). We can see Harold
the pig once and remember what a pig looks like, whereas, a computer needs thousands of examples of a picture of a pig to remember what a pig looks like.
A general rule of a thumb for machine learning is that more (quality) data equals better models.
Document what each piece of information relates to
As more and more data is collected, it’s important to be able to understand what each piece of information relates to.
At Max Kelsen, before any kind of machine learning model is run, the engineers spend plenty of time liaising with subject matter experts who are familiar with the data set.
Why is this important?
Because a machine learning engineer may be able to build a model which is 99% accurate but it’s useless if it’s predicting the wrong thing. Or worse, 99% accurate on the wrong data.
Documenting your data well can help prevent these kinds of misfires.
It doesn’t matter whether you’ve got numerical data, categorical data or a combination of both — if you’re looking to get more out of it, Max Kelsen can help.
This article first appeared on maxkelsen.com.